
Why I No Longer Use My Garmin
Me and my Forerunner 965 used to be the best of friends. We would run together, work together, play together - yes, even sleep together. But those good old days are long gone, and now I only use the Garmin to track my occasional outdoor runs. I’ve found someone new - her name is ventilation.
In fact, ventilation has replaced all of the myriad of other tools I’ve used in the past to gauge fatigue, including an Apple watch, Fitbit, Oura Ring, Whoop strap, Strava, intervals.icu, Runalyze – the list goes on and on. I’ve tried many different tools to assess fatigue because I was never satisfied with the accuracy of any of them, so I was constantly searching for the next best thing. These tools suffer from the same inherent, inescapable flaw – they primarily calculate readiness based on external load and/or heart rate. As discussed in the last few blogs, the difference with ventilation is that it can provide more accurate insights into what is happening metabolically within the muscle. This difference is like the difference between trying to manage your diabetes by counting your macros versus using a glucose monitor. The latter gives you a more accurate picture of your current condition.
Case in point, today I completed an easy run at 12 min/mi pace. Most of my easy runs usually start at a slightly quicker pace and then progress faster depending on my condition, but today I spent the full 45 minutes at this snail’s pace because my ventilation was significantly elevated compared to my baseline – just as I predicted it would be.
- Date
- 9/12/26
- Duration
- 45 min
- Pace
- 12:00/mi
- 6m VE
- 87.8 / 77
- Fatigue
- 81.6 / 73.1

How did I know my ventilation would be elevated? Because the day prior I performed a leg workout consisting of 4 sets/6 reps of squats at 255 lbs and 4 sets/10 reps of RDLs at 160 lbs. Now in my old weightlifting days, this would have been light work as I used to squat much heavier at least 3x a week, but with running now being my main focus, I only squat once a week. And because my legs are less conditioned for heavy work, they are typically sore for the next day or two, which is usually a sign of muscle damage. And because ventilation tracks what is happening metabolically within the working muscles, when my muscles are impaired, it consistently results in higher than normal ventilation. Because all the wearables I have ever owned, including my Garmin, gauge fatigue, in part, by heart rate, they are notoriously bad at assessing load from strength training which ordinarily does not significantly elevate heart rate.
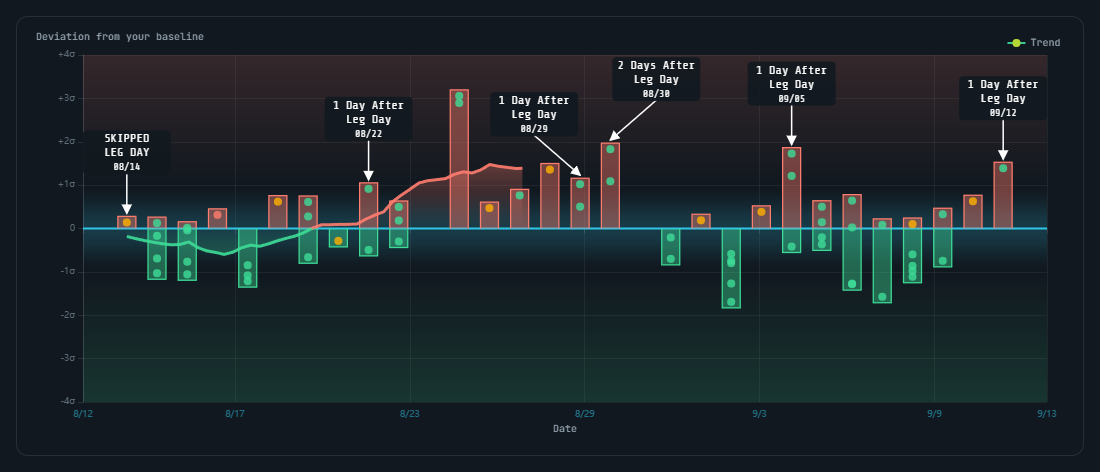
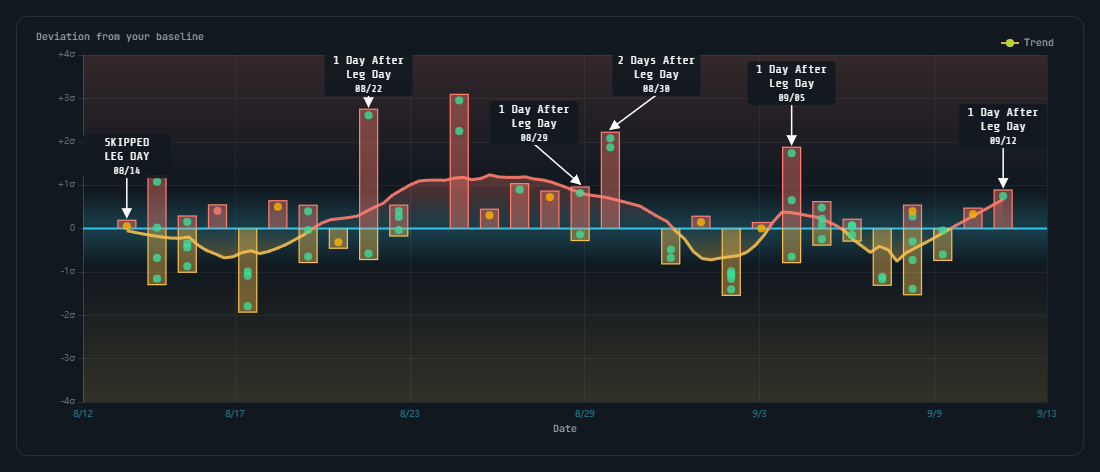
Following are my Trend/Condition graphs for both Ventilation and Fatigue over the past 30 days, which show how much these values deviated from my baseline/average for each run on each day. As you can see, a clear pattern emerges where there is a spike 1-2 days after each of my squat workouts.
I used to think these spikes were just noise, but after a while, I started to notice a pattern. My Ventilation and Fatigue Scores were consistently elevated during periods of high load. In the following graph you can see a cluster of spikes during two such periods, the first when I experimented with double threshold training and the second when I took a weeklong “vacation”, which consisted of me carrying around a fussy 8 month old, walking around for miles at places like Disneyland while continuing my running workouts as programmed.
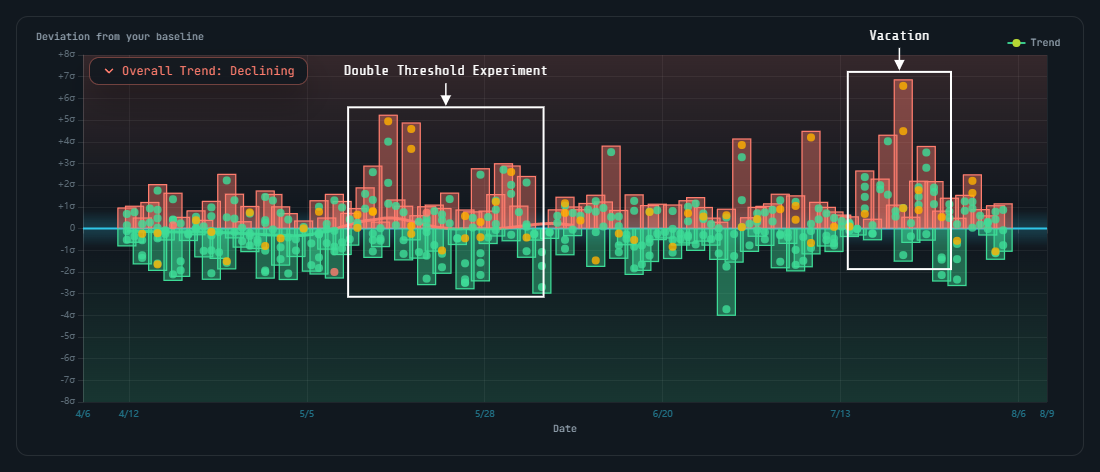
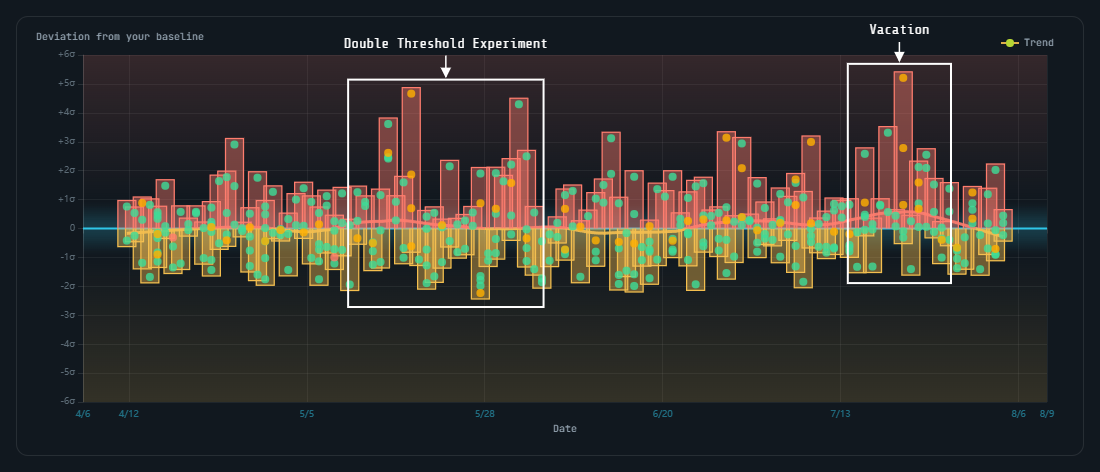
Seeing this consistent pattern repeatedly occur made me realize that these spikes were not noise – they were signal. Although obviously I have not done a muscle biopsy, I believe what is primarily happening is that when my leg muscles are damaged/impaired by the additional load, this impairment reduces the contractile force of such muscles. This, in turn, means that to power the same pace, my body needs to recruit more muscle fibers, which will often be fast twitch fibers due to Henneman’s size principle. And when additional muscle fibers are recruited, particularly fast twitch ones, it increases the oxygen demand and CO2 output, causing ventilation to increase compared to ventilation levels when my condition is normal.
However, notice that in today’s run despite this fatigue, my drift was basically flat as the intensity was still low enough that my body was able to effectively clear the metabolic waste being produced. This is a good example of why the ceiling test, which we discussed in my first blog, can be misleading, even though it is the standard protocol used by runners who control intensity by heart rate or lactate. Because the body’s condition is in constant flux, an athlete’s thresholds are also in constant flux. If, for example, my VT1 was at 87 L/min, and I used a ceiling test to gauge intensity, I would think that my run was over my first threshold, but we can infer from my drift that I was in a metabolically stable state in the moderate domain. And, as discussed in my first blog, thresholds are defined by metabolic stability, not a static, single value.
Although I originally bought the TymeWear VitalPro with a sole focus on using it to control intensity, its ability to accurately gauge my daily condition has, in my opinion, proven to be an even more powerful use case. All of the various tools I’ve used in the past to assess fatigue failed miserably at monitoring my overall load because they do not accurately track the stress incurred from things like strength training, walking or daily life. Because ventilation is directly tied to my current metabolic state, it can provide insights into my condition at any given moment when compared to a baseline.