
What Is VTCheck?
Hello World. Welcome to the first in what I hope will be a regular series of blogs intended to help users get the most out of using VTCheck. In this opening blog, I will describe the primary function of VTCheck and how it differs from the various other training products currently on the market.
Endurance: A Function of Relative Intensity
The primary purpose of VTCheck is to analyze the intensity of endurance exercise. Being able to accurately gauge intensity is critical because, fundamentally, all endurance sports come down to one thing — how long an athlete can sustain a given pace or power output before failure — and there is an inverse correlation between intensity and time to failure. This is because as intensity increases, so do the primary limiting factors of endurance performance, namely carbohydrate depletion, waste accumulation and systemic stress (e.g. muscle damage, hyperthermia, dehydration, neuromuscular fatigue). Furthermore, for every athlete, there are two specific points in intensity, commonly known as thresholds, where these limiting factors cause time to failure to significantly accelerate. As such, these thresholds can be used as reference points to modulate training intensity to induce desired physiological adaptations and manage fatigue.
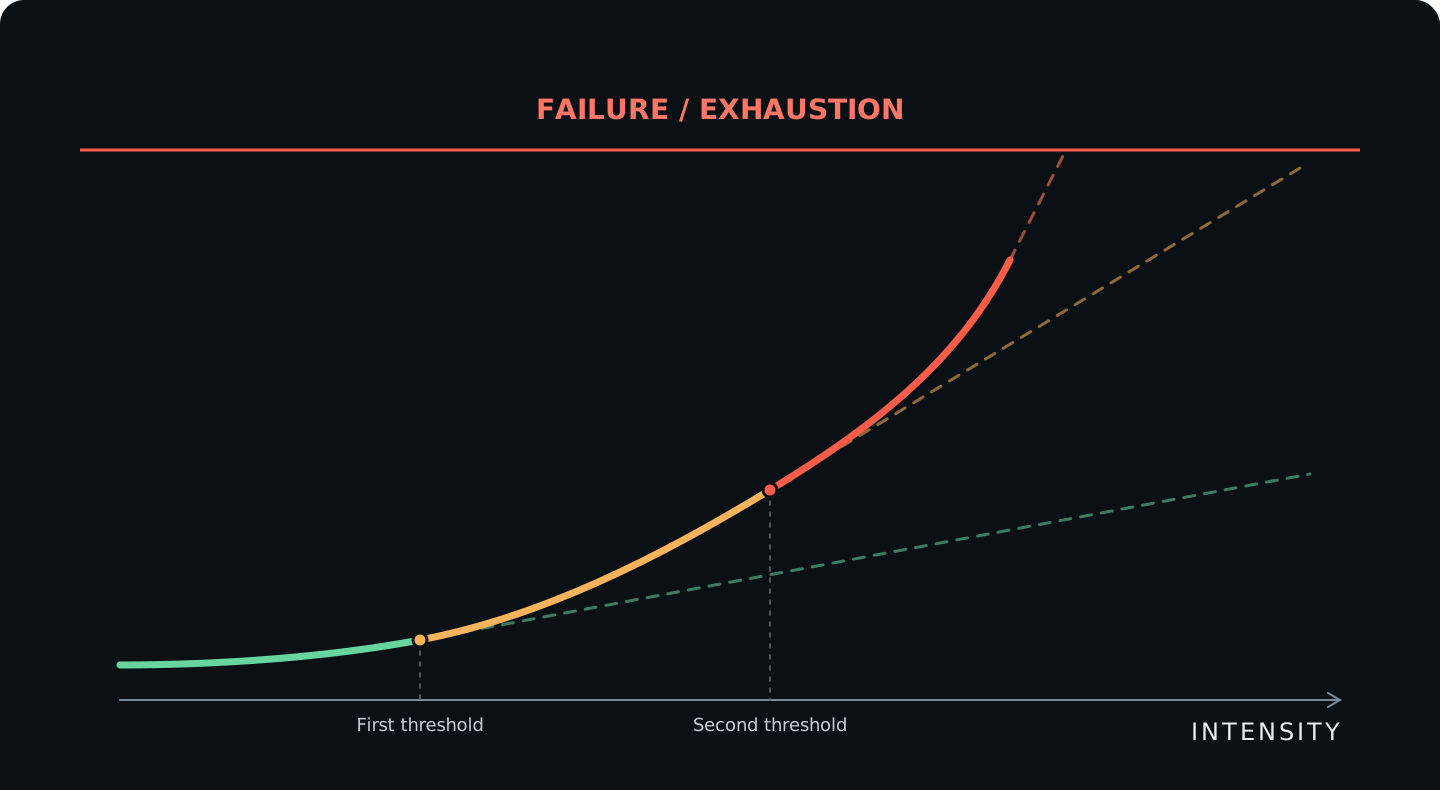
Most people think of thresholds as a number, line or inflection point. However, because an athlete’s thresholds can significantly fluctuate on a daily or even hourly basis, in the world of physiology, thresholds are defined by the intensities at which there is a distinct change in an athlete’s metabolic stability. Metabolic stability can be measured by the homeostatic level of certain physiological markers of energy production – namely heart rate, lactate, VO2, CO2 and ventilation. Since these markers are integral to the metabolic process, they can provide insights into what is happening within an athlete’s working muscles as it relates to carb depletion, waste accumulation and, indirectly, systemic stress.
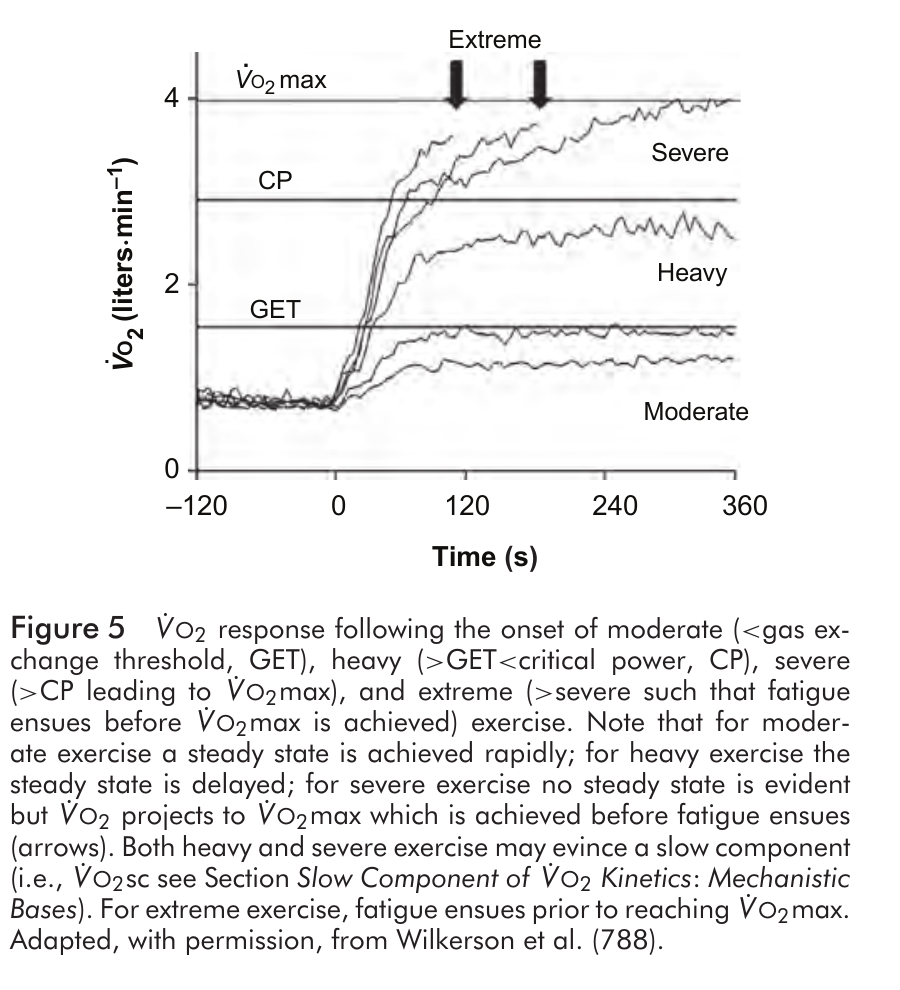
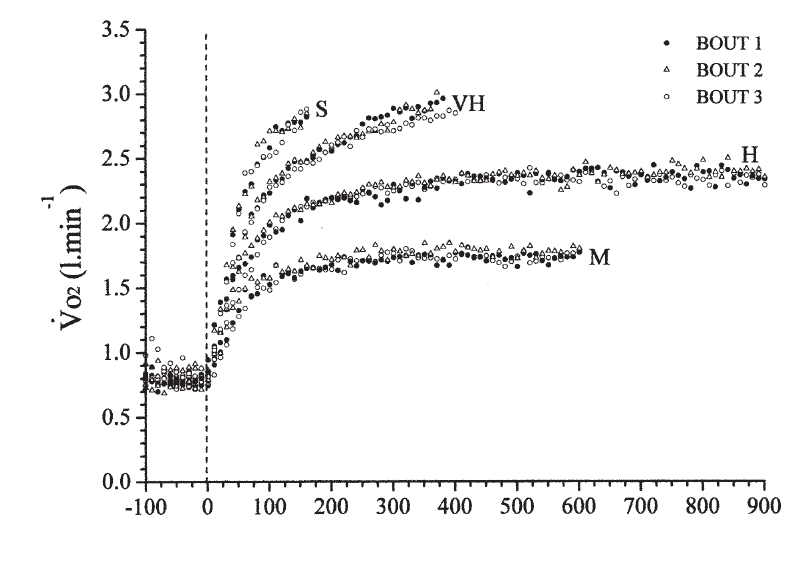
Metabolic stability can be categorized into three distinct domains: (1) Stable, (2) Quasi-Stable and (3) Unstable.
Stable (Moderate): At the lowest intensities, slow-twitch fibers are sufficient to provide most of the power needed to sustain a given pace or power output. Slow-twitch fibers are resilient to mechanical stress, mitochondrially dense and highly efficient at oxidizing fat. The body has virtually unlimited fat stores, and fat oxidation produces little waste. The net effect of the foregoing is that in this domain, metabolism quickly reaches a steady state of homeostasis, which can be sustained for 4+ hours, and recovery typically requires 24 hours or less (depending on duration and modality of exercise).
Quasi-Stable (Heavy): At medium intensities, the body requires more energy to sustain a given pace or power output. Generally, this additional energy comes from the progressive recruitment of fast-twitch fibers and increased glycolytic flux, as carbs can be converted to ATP significantly faster than fat. Fast-twitch fibers are less resilient to mechanical stress and have fewer mitochondria compared to slow-twitch fibers. Fast-twitch fibers also rely more readily on carbohydrate oxidation and anaerobic glycolysis, which produces significant amounts of waste that the body has to work harder to clear. As such, in this domain, it takes an athlete longer to reach a metabolic steady state, usually 10-15 minutes. Heavy efforts can typically be sustained anywhere from 30 minutes to 3 hours, and the damage caused by the metabolic disturbances and systemic stress experienced in this zone usually requires up to 48 hours to fully recover from.
Unstable (Severe): At the highest intensities, energy demands significantly outpace the oxidative/mitochondrial capacity of the athlete. Accordingly, the body relies heavily on fast-twitch fibers and anaerobic pathways to sustain the given pace or power output, producing massive amounts of waste that the body cannot effectively clear, and an equilibrium is never achieved. Accordingly, in this domain, the athlete’s metabolism does not reach a steady state, rendering time to exhaustion relatively short, usually under 30 minutes. Due to the high amounts of metabolic disturbance and systemic stress experienced in this domain, full recovery typically takes in excess of 48 hours.
| Domain | Time to Exhaustion | Potential limits |
|---|---|---|
| Moderate | More than 4 hours | Overheating; declining nervous-system drive; running-related muscle damage. |
| Heavy | Up to approximately 3–4 hours | Loss of available muscle glycogen; overheating. |
| Severe | Up to approximately 30–45 minutes | Exhaustion of finite work capacity above critical power, and/or increasing concentrations of contraction-impairing metabolites. |
How VTCheck Assesses Intensity
VTCheck utilizes statistical modeling based on physiological studies to empirically assess metabolic stability by calculating the level of ventilatory or heart rate drift during exercise. As noted earlier, because ventilation and heart rate are physiological markers integral to energy production (more on that in a later blog), they can provide insights into the metabolic state of an athlete’s working muscle. By analyzing the drift of these markers, we can then “reverse engineer” which zone an athlete is in and the relative intensity of his workout.
For example, the following graph depicts a 30-minute run at 10:43 per mile pace recorded on August 13, 2026, with the green line showing the ventilatory trend over time. From minutes 3 to 6, ventilatory drift was -0.15 liters per minute. From minutes 15 to 30, ventilatory drift was 0.2 liters per minute. And overall, for the full 30 minutes after the initial ramp-up period, ventilatory drift was 0.04 liters per minute. Accordingly, since ventilation was stable over the entire run, we can infer that the body was primarily utilizing slow-twitch fibers and fat oxidation to power the effort, and the level of metabolic disturbance and systemic stress was low. As such, the run is classified as moderate.

This next example depicts a 21-minute run at 7:19 pace recorded on May 2, 2026. In this case, ventilatory drift was 2.29 L/min from minutes 3 to 6, 0.9 L/min from minutes 15 to 21 and 1.31 L/min over the entire run. This pattern is representative of a prototypical Quasi-Stable/Heavy kinetic shape. Unlike a Moderate workout, ventilation shows significant drift after the initial 3-minute ramp-up period, and unlike a Severe workout, ventilation eventually stabilizes after minute 15 (the ceiling of my expected drift in the Moderate domain is 1 L/min).

Finally, the following example depicts a 21-minute run at 7:12 pace recorded on May 9, 2026 (1 week after the prior Heavy run). In this case, ventilatory drift was 5.25 L/min from minutes 3 to 6, 2 L/min from minutes 15 to 21 and 3 L/min over the entire run. Unlike a Moderate or Heavy run, drift is very high initially and continues to be significant after 15 minutes. This represents a paradigm workout in the Unstable/Severe domain, where waste accumulation exceeds clearance, resulting in increasing CO2 production, which, in turn, triggers a higher volume of breathing that fails to reach an equilibrium.

Assessing Metabolic Stability for Other Types of Workouts
Although metabolic stability is most accurately verifiable for constant-load workouts 20 minutes or longer, it is possible to use VTCheck to assess metabolic stability for shorter and variable-pace workouts as well by analyzing one or more of the following metrics:
Initial Drift Amplitude: If you look back at the graphs from this discussion, one thing you’ll notice is that there is a clear pattern between (a) overall metabolic stability and (b) the initial level of drift shortly following the ramp-up period. This makes physiological sense because at the highest intensities, the body relies heavily on anaerobic pathways (i.e. glycolysis and the phosphocreatine system) while the aerobic system is warming up, producing large amounts of waste almost immediately. This waste causes significant metabolic disturbance in the environment around the working muscles, impairing their function, which, in turn, triggers additional fast-twitch fiber recruitment, producing even more waste. In the Severe domain, the body fails to stabilize this vicious cycle. Accordingly, we can reasonably “predict” whether a run will metabolically stabilize and fall within the Moderate, Heavy or Severe domains by measuring the drift amplitude of the athlete’s heart rate or ventilation after the ramp-up period for workouts as short as 6 minutes. Conceptually, the angle/trajectory of the drift can give us an indication of how quickly the athlete is headed towards exhaustion at the given intensity (see Figure 1). However, note that since changing intensity will alter metabolism and therefore heart rate and ventilation, in order for an initial drift value to be a reliable indicator of metabolic stability, it must be from a workout at or near a constant load.

Interval Drift: For interval workouts, including those shorter than 6 minutes in duration, metabolic stability can also be estimated by analyzing the overall trend of the intervals throughout the session. The general idea is that if ventilation or heart rate continues to significantly rise for each interval despite the enhanced clearance of waste occurring during recoveries, it’s a signal that the athlete’s metabolism is not stabilizing and may be entering the Severe domain. However, if ventilation or heart rate stabilizes after the first few intervals, it’s a signal that the athlete may be in the Heavy domain. It should be noted that the length of both the interval and the recovery period between intervals will impact how accurate this test will be.

Ceiling Test: If an athlete has a reasonable estimate of his heart rate or ventilatory thresholds (e.g. from a prior ramp test), the athlete can assess the relative intensity of his workouts based on where his heart rate or ventilation sits compared to such thresholds. This is the protocol most athletes using heart rate or lactate rely upon. As noted earlier, because thresholds can fluctuate significantly, this approach may not be accurate on a given day, but it may be the only means available for very short workouts or workouts at varying paces.

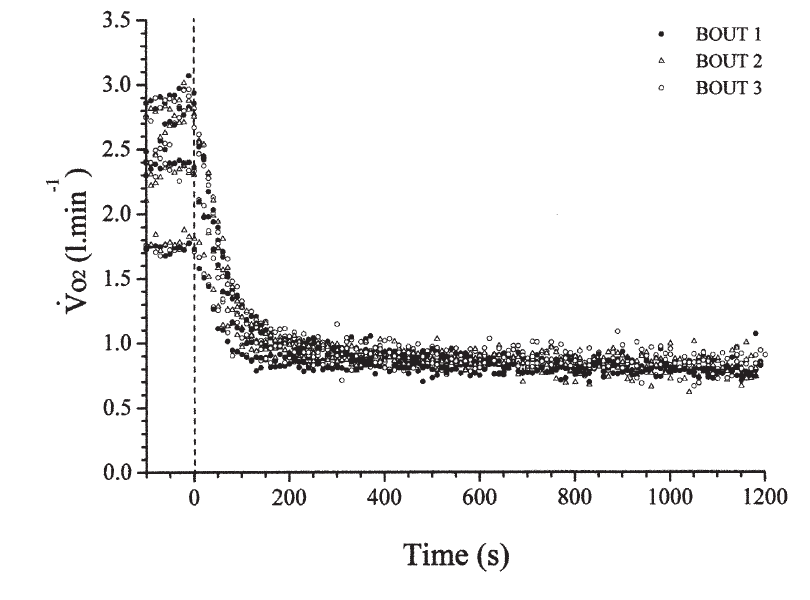
Recovery Score: For VitalPro users, the Recovery Score can be used to help estimate workout intensity independent of drift. We will provide a more thorough explanation in a later blog, but in simple terms, the Recovery Score measures how much ventilation returns toward baseline during the first minute after exercise. Because exercise intensity influences post-exercise recovery, in part as a result of the anaerobic contribution, this provides another way to assess how demanding a bout was. Note that to receive a Recovery Score, the athlete should record at least 60 seconds of standing recovery immediately following the bout, along with the required pre-exercise baseline. Also note that the Recovery Score may not accurately reflect intensity for short intervals that are separated by long recoveries, which can reduce the accumulated metabolic strain between bouts.
Summary
- Three of the primary limiting factors of endurance activities are carbohydrate depletion, waste accumulation and systemic stress, with the impact of each depending on the duration and intensity of exercise.
- These limiting factors are dictated in large part by metabolism, which is driven by several factors including total energy demand, muscle fiber recruitment, substrate availability and oxidative/mitochondrial capacity.
- Every athlete has two thresholds in intensity where a distinct shift in metabolism occurs, accelerating the impact of these limiting factors.
- These thresholds delineate three distinct intensity domains which can be targeted during training to induce specific adaptations and manage fatigue: (a) the Moderate domain where metabolism reaches a steady state typically in 2-4 minutes; (b) the Heavy domain where metabolism reaches a steady state typically in 10-15 minutes; and (c) the Severe domain where metabolism doesn’t reach a steady state.
- VTCheck can assess intensity domains and metabolic stability by calculating heart rate and ventilatory drift during exercise.