
Drift Pt I – Drift Model, Ramp-Up Speed and Slow Component Start
As discussed in our first blog, endurance performance is largely a function of metabolism. If metabolism is stable, the effort can be sustained for some duration. The more unstable metabolism is, the more rapidly exhaustion tends to occur.
In very simple terms, metabolism is stable when energy production meets demand and waste production and clearance reach an equilibrium. This generally results in the primary components of the energy production process achieving a steady state – such as VO2, CO2, lactate, ventilation, heart rate, ATP, PCr, H+, Pi etc.
In contrast, metabolism is unstable when energy production and waste accumulation are in flux, causing the primary components of the energy production process to drift. This may occur when ATP production struggles to keep up with the demands of the given pace or power output and/or when waste cannot be recycled or cleared as quickly as it is produced, resulting in fatigue.
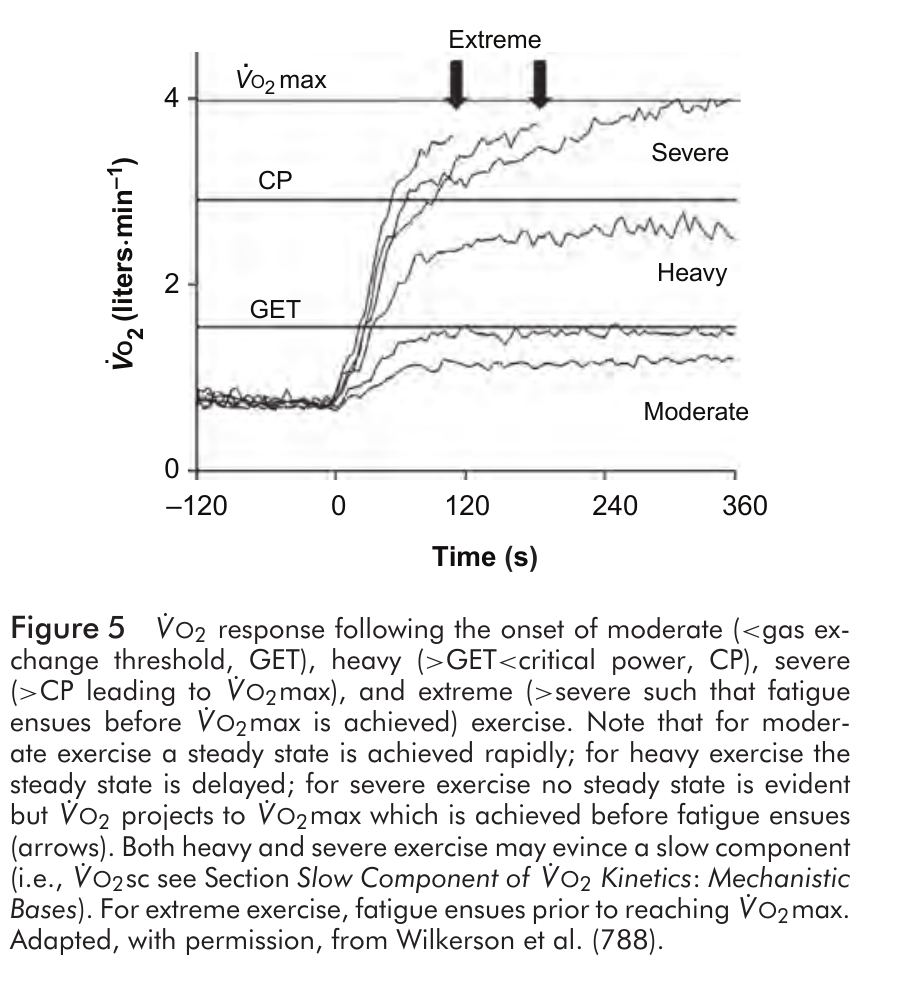
Accordingly, we can measure the drift of the components of metabolism as a proxy to assess metabolic stability. This is the primary function of VTCheck, which analyzes the level of ventilatory or heart rate drift during constant load exercise by utilizing a mathematical tool called exponential kinetic fitting. Because both ventilation and heart rate (as well as VO2 and CO2) are integral components of metabolism, they tend to follow the same general kinetic shape during exercise – a rapid increase at onset that slowly tapers as the workout continues – and this shape changes in a consistent way based on the intensity domain/zone of exercise.
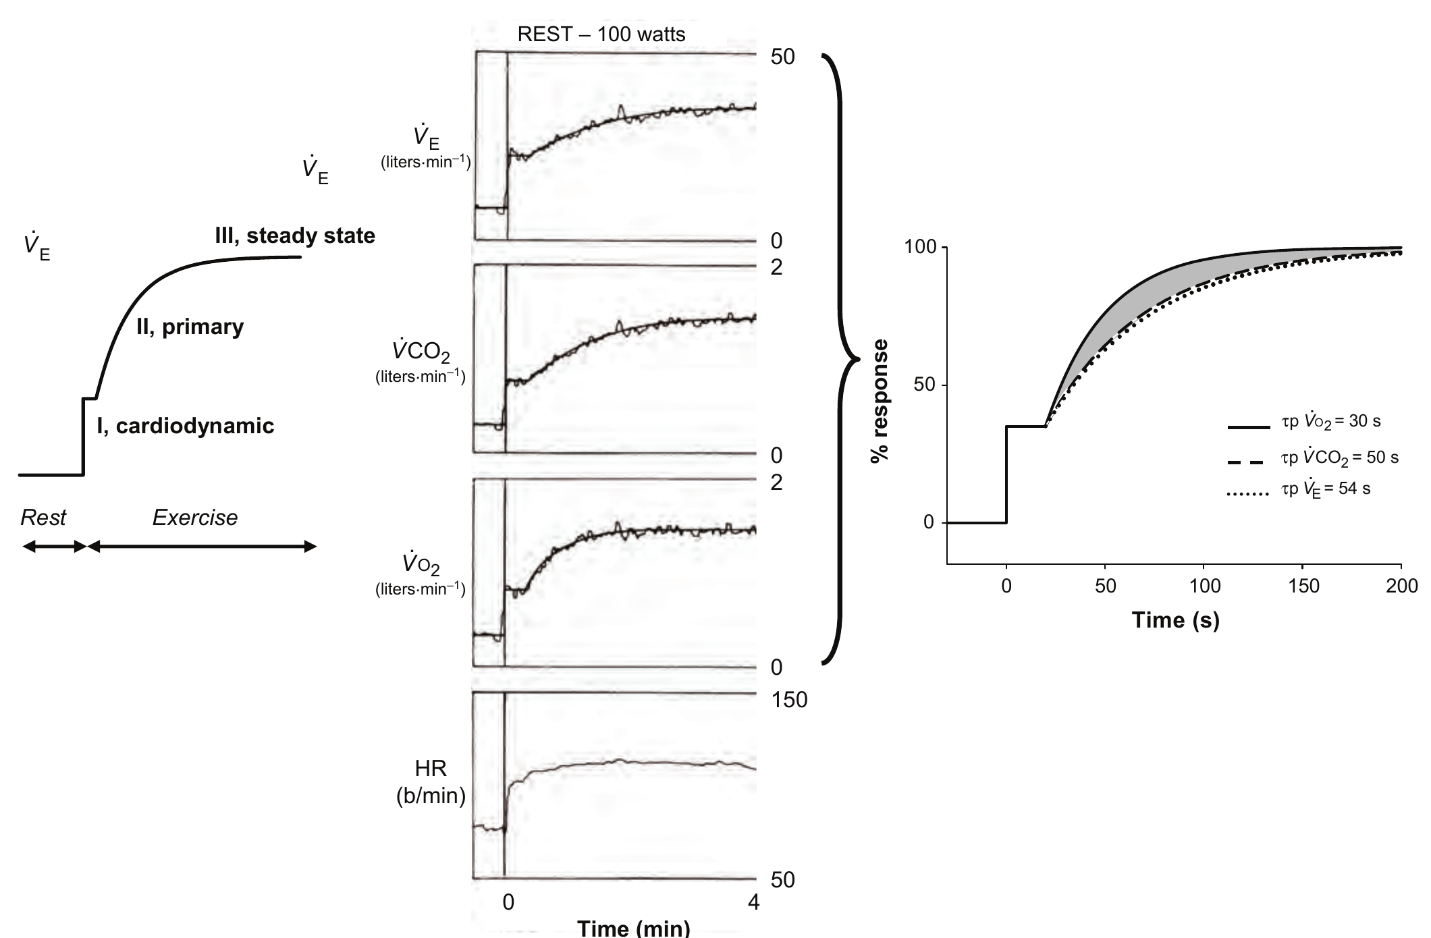
As such, for decades physiologists have been applying exponential kinetic fitting to these metabolic markers, which allows for the extraction of valuable information about the given workout, such as (1) how long it takes for each component to ramp up, which tends to be an indication of fitness, and (2) the level of drift, if any, of such components following the initial ramp up period, which tends to show how stable or unstable metabolism was during the workout, and therefore the applicable intensity domain.
Drift Model
Although there are many different ways that exponential kinetic fitting can be applied to metabolic data, the two primary models used in the literature historically have been the monoexponential and biexponential models. As their names suggest, the difference between these models is that the monoexponential model fits one curve to the data and the biexponential model fits two. There are pros and cons to these approaches, making the superiority of one model over the other a subject of debate within the exercise physiology community for years.
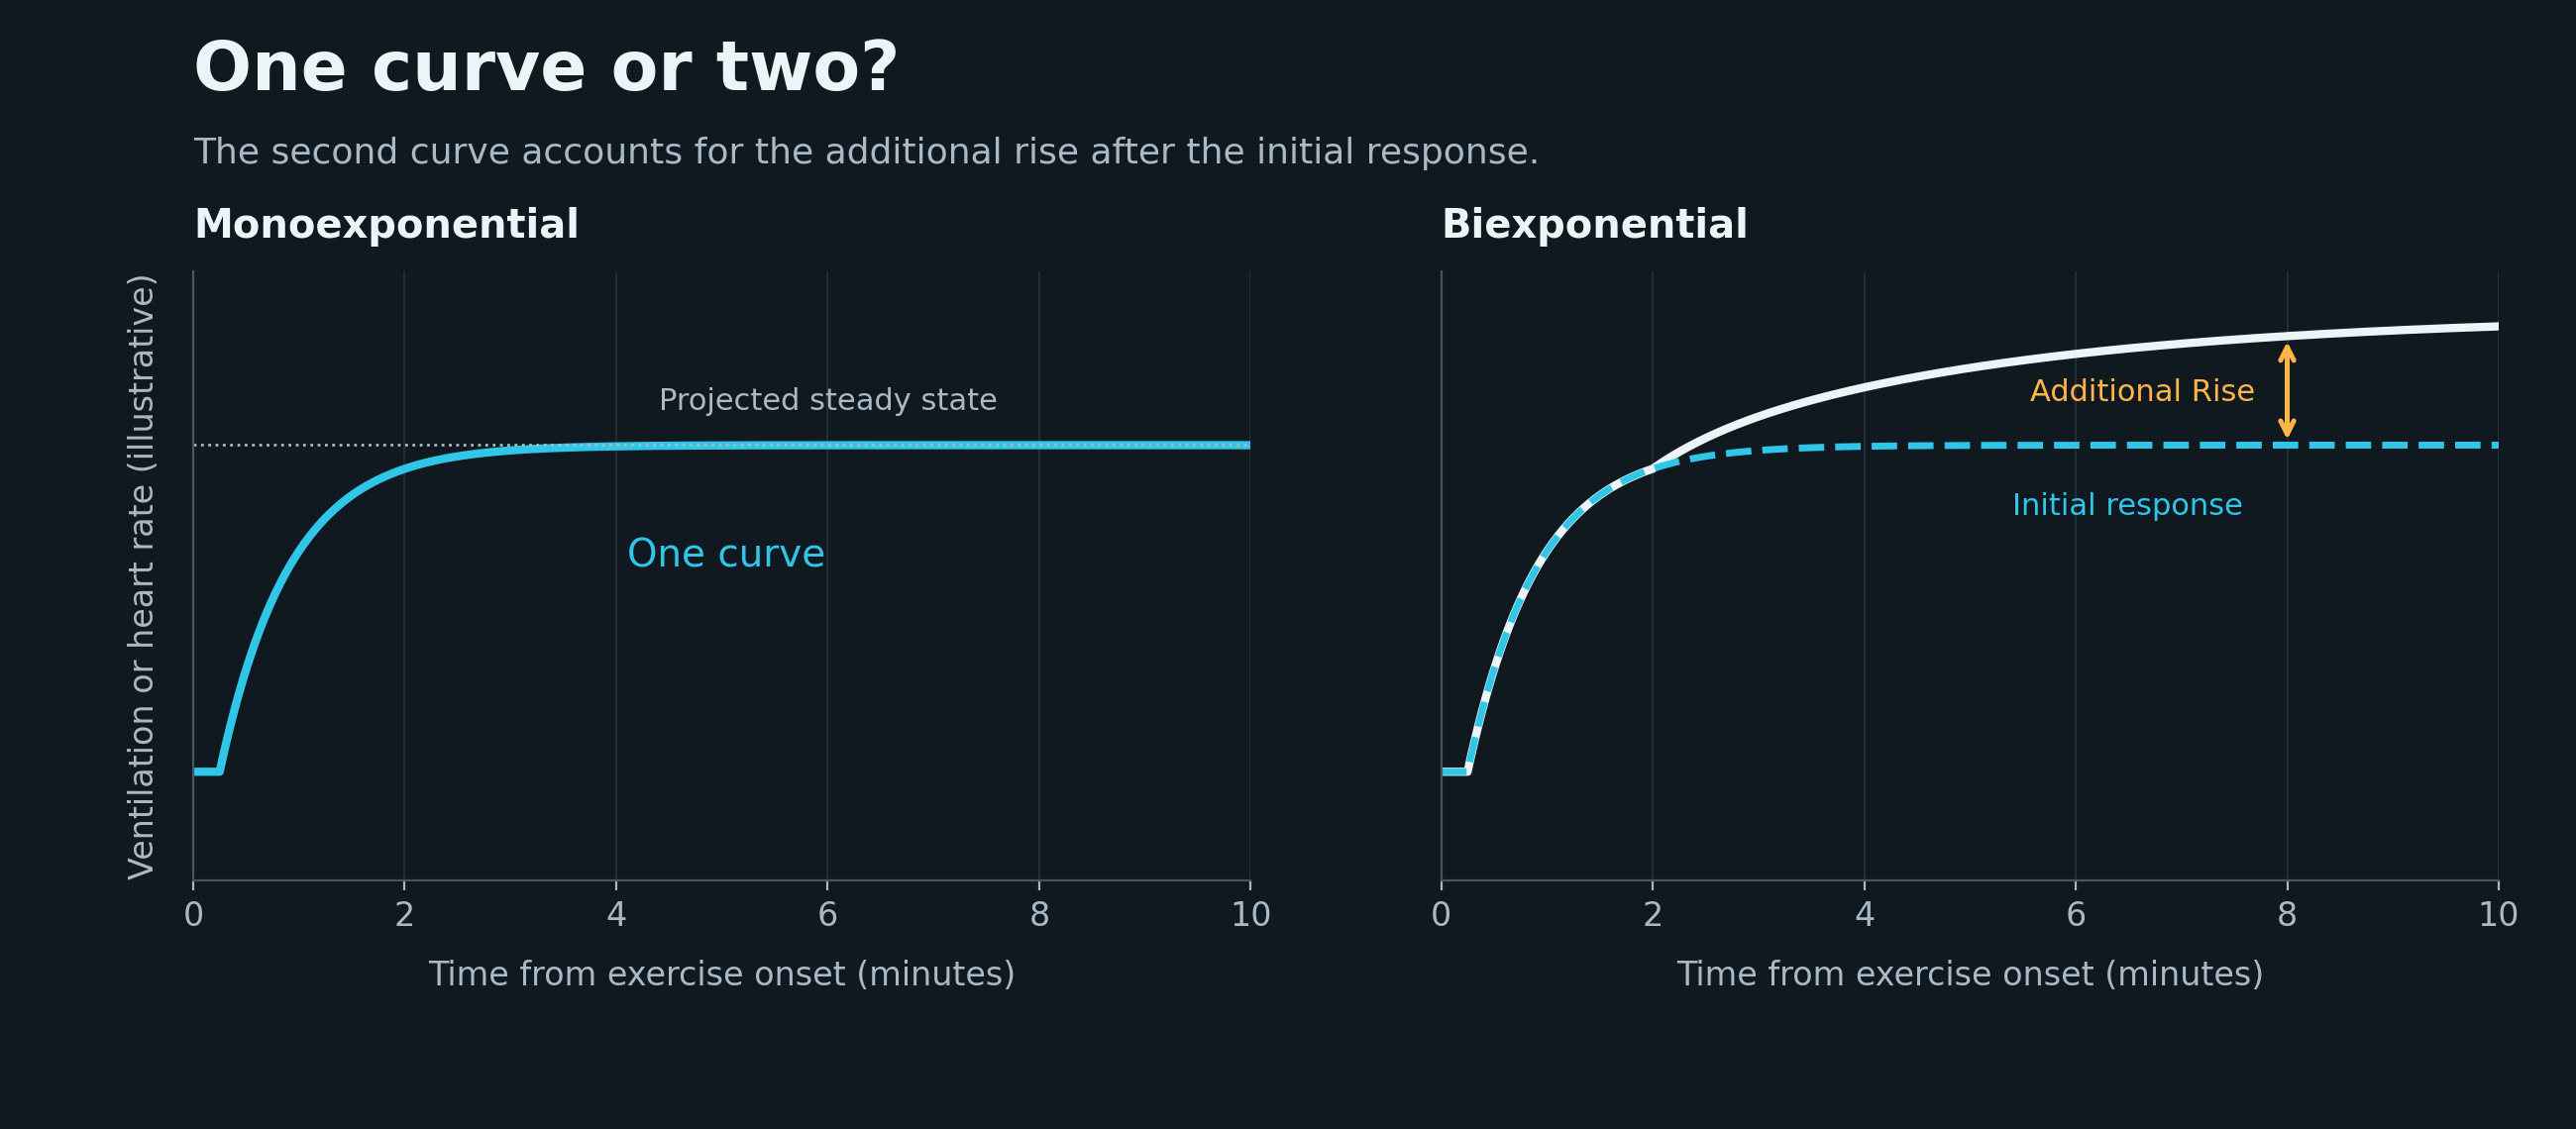
The biggest advantage of the monoexponential model is that it is simpler to apply and tends to result in more consistent results since it only requires fitting one curve, consisting of 4 variables. Because the biexponential model fits two curves, it consists of 7 variables. This can make fitting more complicated and inconsistent, because essentially, these functions “solve” for all variables simultaneously to find the shape that best fits the data by choosing the curve that minimizes the distance between the curve and each data point.
However, the main disadvantage of the monoexponential model is that since it only fits one curve, it cannot properly take into account the drift that occurs after the ramp up period in the heavy and severe domains. If you try to fit a monoexponential curve to all of the data from a heavy or severe workout, it will extend the ramp up portion of the curve upwards and outwards as it tries to take into account the later drift. Physiologists mitigate this effect by limiting the portion of the data that the function is allowed to “see”. For example, if a runner’s aerobic system typically takes 3 minutes to ramp up, we only apply the function to the first 3 minutes of ventilatory or heart rate data so it fits the curve to just that portion instead of trying to fit it to the later part of the workout which may contain drift. We then assess the difference between the amplitude of where the data actually ends up and the steady state asymptote projected by the monoexponential function from the first 3 minutes to determine the level of drift.
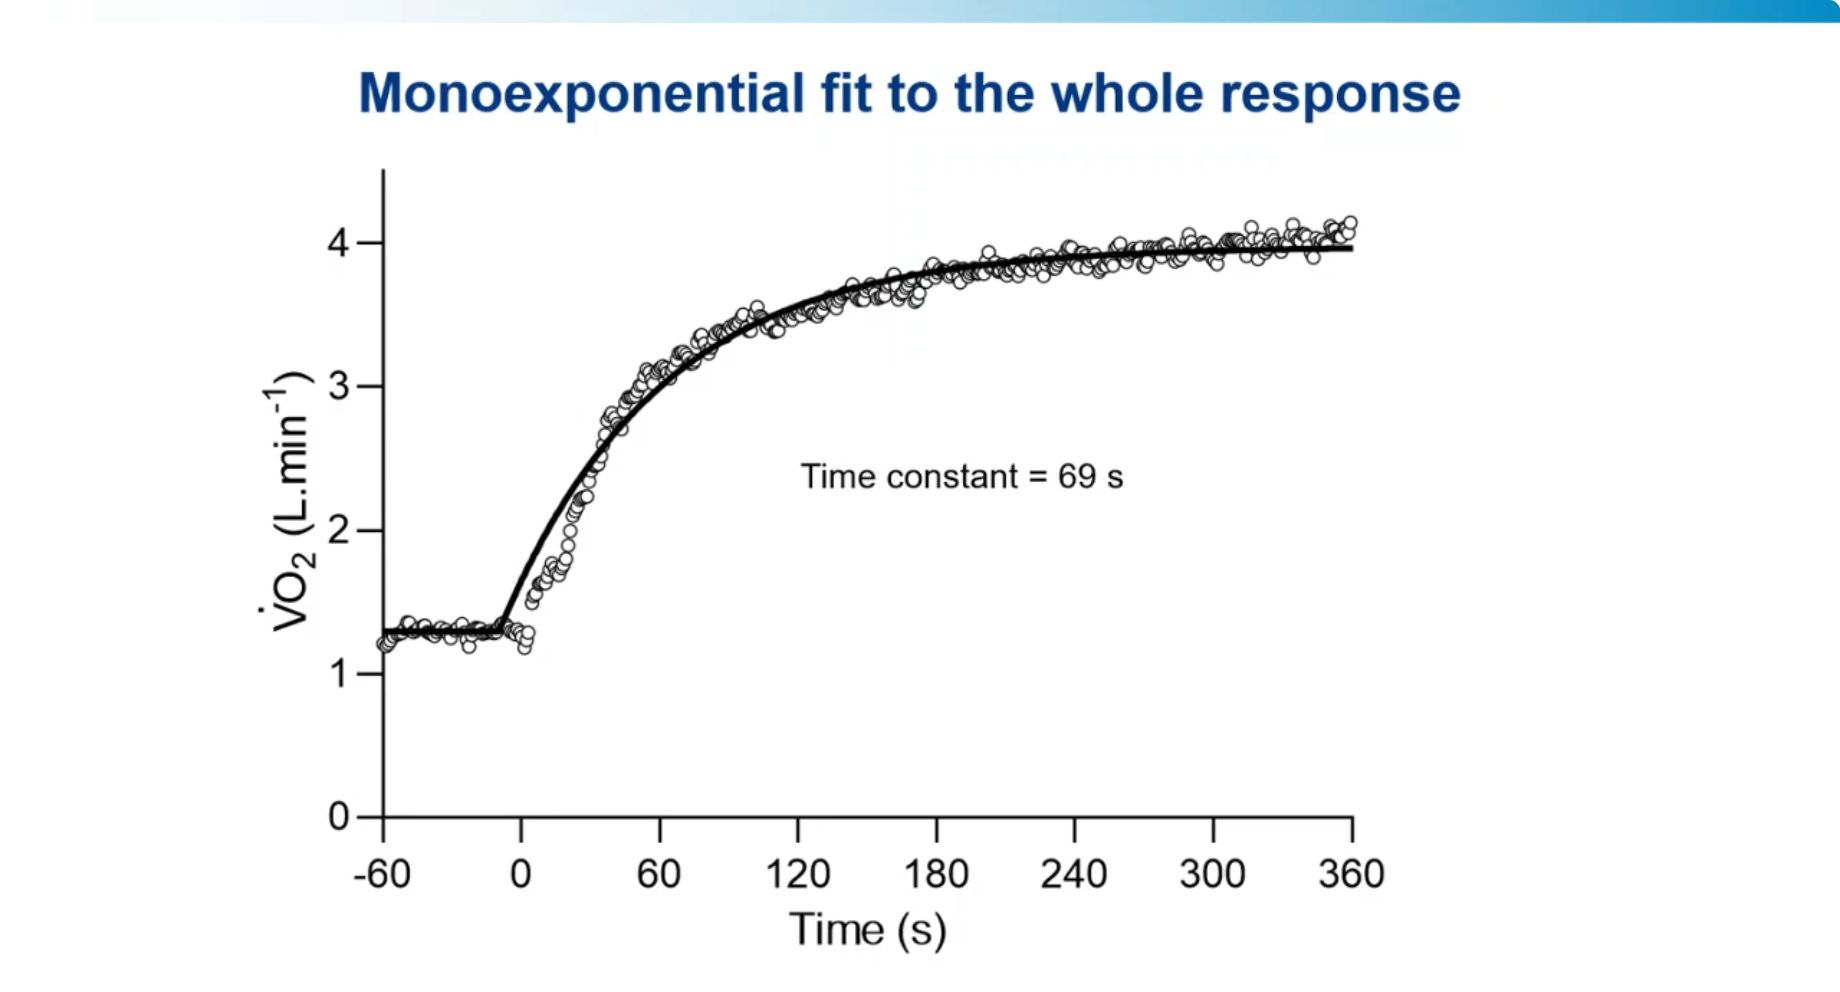
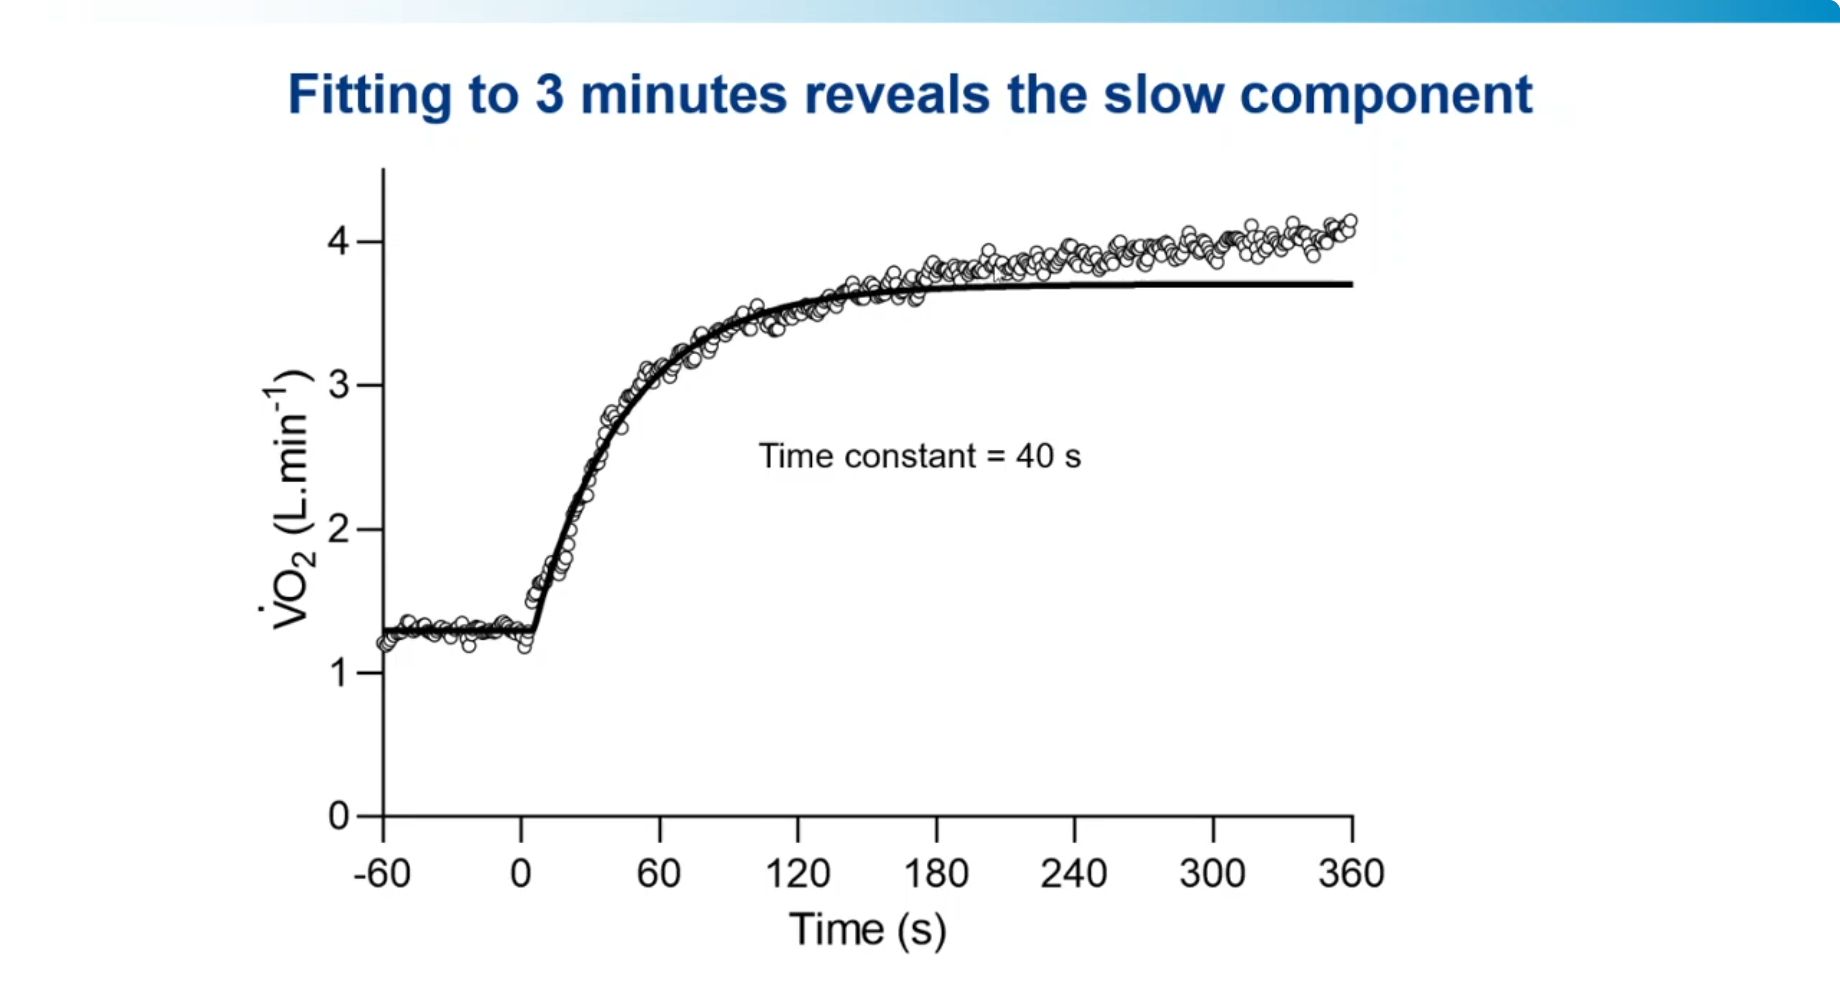
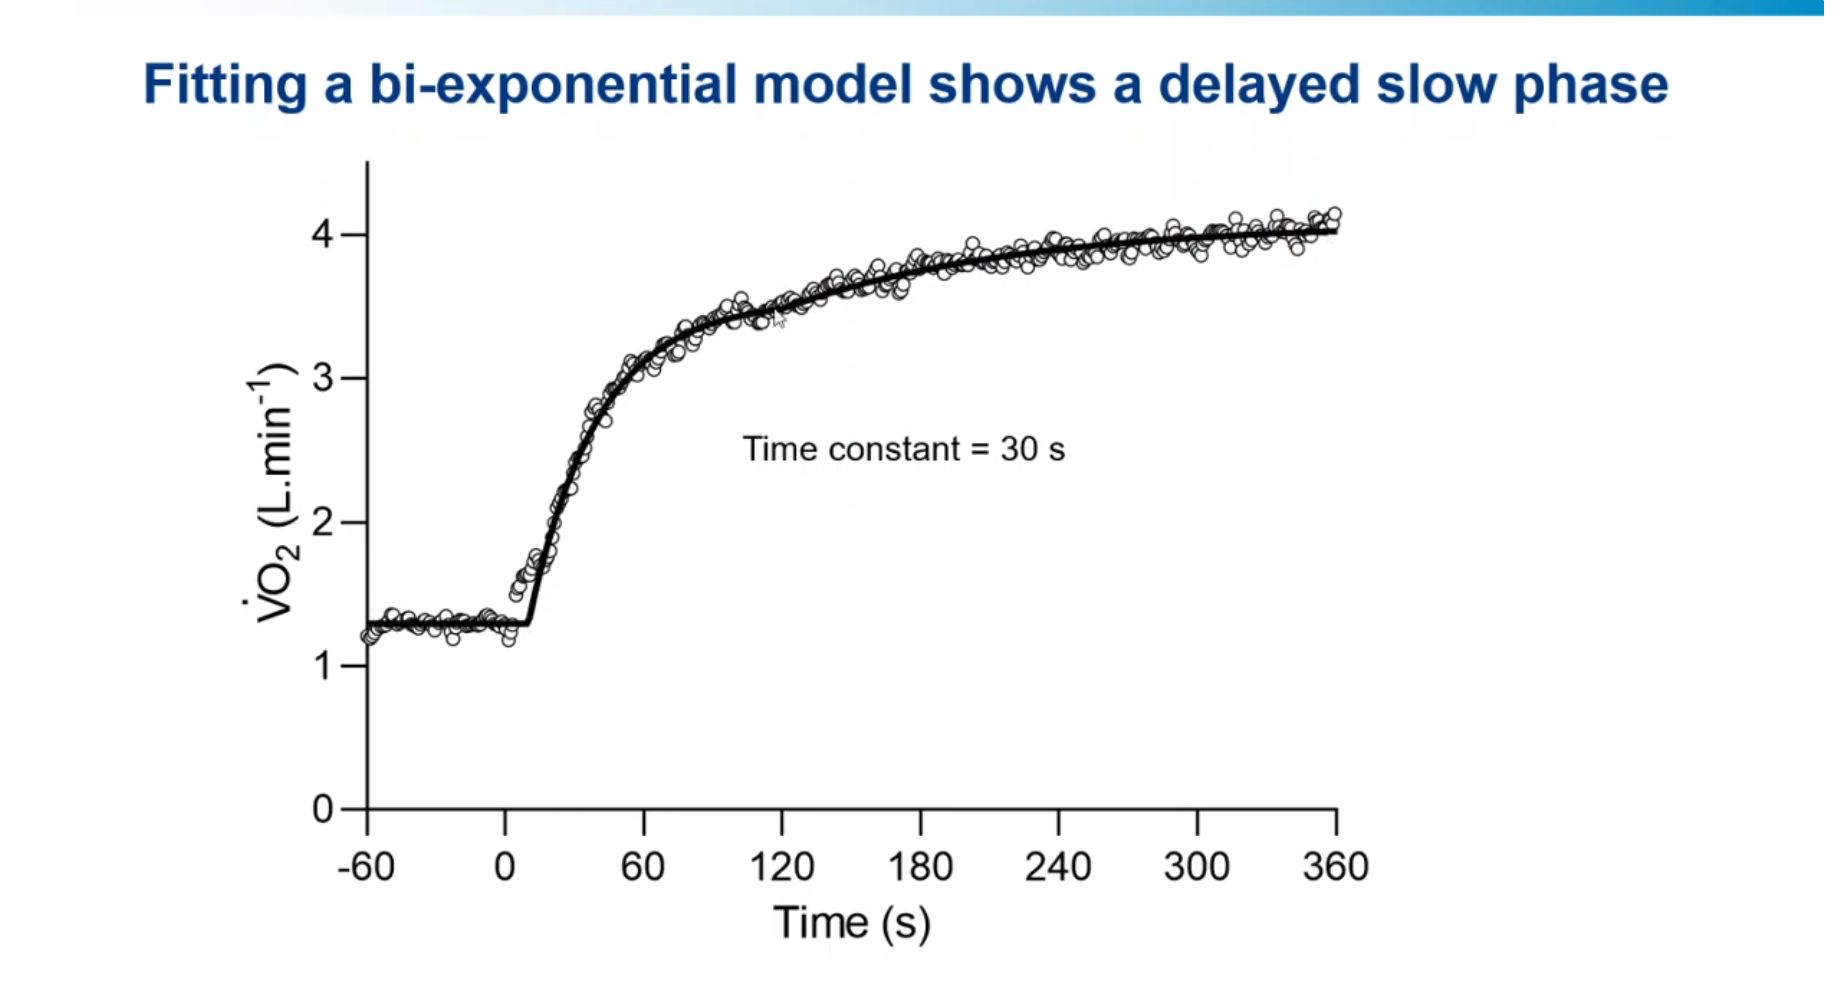
In contrast, the biexponential model fits two curves to the data – one curve is fitted to estimate what the athlete’s ventilation or heart rate would be if he reached a steady state immediately after the ramp up period, and a second curve is fitted to the additional rise, or drift, of the athlete’s ventilation or heart rate above the projected steady state.
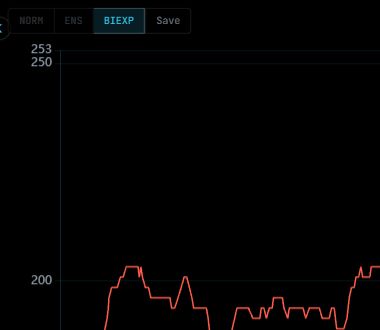
Since both models have pros and cons and both are used by reputable physiologists for research purposes, VTCheck allows VitalPro users to choose which model they want to employ for their unique data with the Drift Model switch in the Advanced settings of the side bar.
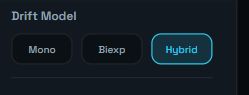
The Hybrid option, as the name suggests, uses a combination of the monoexponential and biexponential models depending on the level of ventilation from the workout. If the workout’s ventilation at 6 minutes is at or below VT1, hybrid selects the monoexponential model since workouts in the moderate domain generally should not have significant drift. If the workout’s ventilation at 6 minutes is above VT1, hybrid selects the biexponential model since workouts in the heavy and severe domains generally should have significant drift.
Our general recommendation is for VitalPro users to select the Hybrid option initially and assess whether the curves appear to follow the general trend of their breath data and whether their ventilation and drift levels appear to be appropriately differentiated between moderate, heavy and severe workouts. Users can test how changing from monoexponential to biexponential, and vice-versa, alters the ventilation and drift levels by toggling this switch in the upper left hand corner of each workout’s analysis. For most workouts, the differences between the models should not be very significant.
Ramp-Up Speed
To assess metabolic stability, drift is only measured after the initial “ramp-up” period at the start of exercise. The reason for this is that metabolism will always be unstable at the start of all efforts, even very easy ones, primarily due to how long it takes for the aerobic system to warm up. Before the aerobic system warms up, ATP demand for the exercise is met partly through anaerobic sources (glycolysis and phosphocreatine), but their contribution begins to taper off as the aerobic system gets up to speed. As such, during the ramp-up period, metabolism is in a state of dynamic flux.
After the aerobic system has warmed up, in the moderate domain, by definition, metabolism (and its related markers such as ventilation and heart rate) quickly reaches a steady state, with little to no drift, whereas in the heavy and severe domains, metabolism continues to fluctuate mainly due to muscle fatigue. So the physiological markers of metabolism, such as ventilation and heart rate, continue to drift, usually for at least 10 minutes in the heavy domain and indefinitely in the severe domain (until the athlete reaches exhaustion or each component hits its maximum value—i.e., maximum heart rate or maximum ventilation).
Accordingly, VTCheck only measures heart rate and ventilatory drift after the ramp-up period has ended, which will be different for each person. Generally speaking, an athlete whose aerobic system ramps up faster will be fitter and an athlete whose aerobic system ramps up slower will be less fit. The Ramp-Up Speed toggle in the Advanced parameters of the side bar allows users to customize their ramp up speed to match their unique physiology.
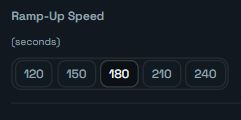
In addition to the Ramp-Up Speed setting determining when the drift measurement begins, it also serves a couple other core functions. When the monoexponential function is applied to analyze a workout, the Ramp-Up Speed setting also limits how far into the workout the algorithm can “see”, to avoid fitting the curve over later drift. Additionally, for both the monoexponential and biexponential models, this setting restricts the maximum tau value. Tau is a measure of time used to estimate the duration of the ramp-up period.
| Time elapsed | Percentage of the initial rise completed |
|---|---|
| 1 tau | 63.2% |
| 2 tau | 86.5% |
| 3 tau | 95.0% |
| 4 tau | 98.2% |
| 5 tau | 99.3% |
The purpose of the tau constraint is to safeguard against the scenario where the exponential function selects an unreasonably long tau which will then impact the projected steady state and therefore the drift value. You can check the estimated tau for each of your individual workouts in the runs list table and your calibrated tau (calculated from all of your runs) in the Advanced parameters of the side bar.

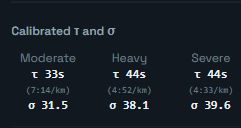
The tau value for your runs can be used to estimate your appropriate Ramp-Up Speed. Generally, your Ramp-Up Speed setting should sit somewhere between 4tau and 5tau (using your calibrated moderate tau) so that the algorithm can see data up to the point where it has functionally reached a steady state, but not beyond that to avoid it picking up later drift. In order to estimate your total Ramp-Up Speed, a 15-second “time delay” should be added to your 4–5 tau calculation to account for the initial response lag, which for ventilation partly reflects the time needed for blood to travel from the working muscles to the lungs.
For example, my calibrated tau in the moderate domain is 33s. So my Ramp-Up speed should be between (a) 15s + 4 x 33s = 2 minutes 27 seconds and (b) 15s + 5 x 33s = 3 minutes. Because my heavy and severe domain calibrated tau values are higher (44s) than my moderate domain tau (which will typically be the case), I use the top end of this range with a Ramp-Up Speed setting of 180 seconds. Note that if the tau value for your individual runs consistently hits the maximum tau for your Ramp-Up Speed, it likely means you need to increase the duration of your Ramp-Up Speed setting.
Another way to assess your Ramp-Up Speed is by observing your slope value using the VTCheck mobile app at the start of your low to mid Zone 2 runs. The slope value measures the difference between your current VE and your VE 30 seconds prior. Accordingly, on most mid to low Zone 2 runs, your slope value should settle near 0 (or possibly go negative) around the time your ramp-up period ends. If the slope remains high when your ramp-up period ends, it is recommended to try a slower Ramp-Up Speed setting. If your slope levels off significantly prior to when your ramp-up period ends, it is recommended to try a faster Ramp-Up Speed setting.
Slow Component Start
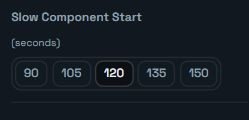
As noted above, the biexponential model fits two curves to the data. The second curve, which measures the drift of a heavy or severe domain workout, is often referred to in physiology literature as a slow component. Because the timing of the slow component will be different from person to person, and will impact the calculated drift, there is a toggle in the Advanced parameters of the side bar to allow users to experiment with different settings. Note that when you change the Ramp-Up Speed setting, VTCheck will by default automatically select a Slow Component Start setting that is generally appropriate for that Ramp-Up Speed, but this may need manual adjustment depending on the individual.
Finding the Right Settings Through Trial and Error
Although the default settings should generally work for most recreational athletes, in order to optimize your use of VTCheck, it is recommended to experiment with different settings to see which combination of settings best fits your unique data. The overarching goal is to find the combination of settings that (a) make most of your moderate domain workouts have little to no drift; (b) make most of your heavy domain workouts have moderate drift; and (c) make most of your severe runs have high drift. Keep in mind that because thresholds can fluctuate, and the data has some degree of noise, there will be some overlap in drift values, particularly right around the thresholds. The goal here is not perfection. The goal is to attain consistent separation among the domains. Following are a few tips that can help you find the optimal settings for you:
- Find your estimated Ramp-Up Speed for moderate workouts first using the guidelines discussed above.
- For the monoexponential model, increasing the duration of the Ramp-Up Speed tends to decrease drift as it allows the algorithm to see a greater proportion of the data, including potentially some of the slow component drift. Decreasing the duration of the Ramp-Up Speed tends to increase drift as it limits the portion of the ramp-up the function can see, which may result in an underestimation of the steady-state amplitude.
- The slow component tends to occur sometime shortly before the primary curve reaches a steady state, so as a starting point, it is recommended to try a Slow Component Start time somewhere between 3 and 5 times your calibrated tau for the moderate domain (plus the approximate 15-second time lag). The Slow Component Start should not occur later than your Ramp-Up Speed.
- Increasing the Slow Component Start time tends to decrease drift as it limits the portion of the initial ramp-up the second curve can account for. Decreasing the Slow Component Start time tends to increase drift as it increases the portion of the initial ramp-up the second curve can account for.
- Test different settings while analyzing workouts in different domains to try to find the combination that separates the drift levels among moderate, heavy and severe runs most cleanly. Once you’ve settled on a combination of settings, stick with them until your fitness materially changes or they seem to be materially erroneous. It’s more important to have consistent settings across all your workouts than to have perfect settings for each workout, and you can always modify your Expected Drift and VT1/VT2 thresholds to help find the right balance between domains (more on that in Drift pt II).