Your Heart Rate Monitor is LYING to You (Pt II)
In our last training log, we discussed how heart rate can be heavily impacted by core temperature causing it to decouple from an athlete’s metabolic state. Today’s session offers more evidence of this phenomenon.
One week ago, at a hot commercial gym, I completed the following session:
- Pace
- 7:36/mi
- Avg VE
- 157.5 L/min
- Avg HR
- 159 bpm
- End VE
- 160 L/min
- End HR
- 165 bpm

Today, at a cooler apartment gym, I completed essentially the same session:
- Pace
- 7:36/mi
- Avg VE
- 156.8 L/min
- Avg HR
- 154 bpm
- End VE
- 161 L/min
- End HR
- 160 bpm

Technically, last week’s run was slightly slower (12.7 kmph) than this week’s run (7.9 mph), and the higher average VE from last week’s intervals was driven in large part by the 4th interval, where I suffered from gastric distress, elevating my breathing. That said, overall, ventilation remained consistent between both weeks (6m VE was nearly identical at 158.6 and 158.4), whereas my heart rate dropped significantly in today’s session, by 5 bpm, in the cooler apartment gym. If I only had heart rate to assess intensity, I could incorrectly assume that intensity decreased during today’s session, but from a metabolic standpoint, it did not.
And this impact of heat on heart rate independent of metabolic demand was even more pronounced between my second warmup and my second cooldown.
- Pace
- 8:20/mi
- Avg VE
- 117.3 L/min
- Avg HR
- 129 bpm

- Pace
- 9:50/mi
- Avg VE
- 81.9 L/min
- Avg HR
- 131 bpm

As you can see, despite the fact that my warmup was at a significantly faster pace than my cooldown (8:20/mi vs. 9:50/mi), my avg heart rate was actually higher during the cooldown as a result of my core temperature being elevated after the intervals (129 bpm vs. 131 bpm). Another example of heart rate failing to track relative intensity.
Pro Tip: For VitalPro users, one way to quickly assess whether heart rate has become decoupled from metabolic state is through the Fatigue Score. We will provide an in-depth explanation of the Fatigue Score in a later blog, but simply put, the Fatigue Score is the ratio of your Ventilation to your Heart Rate at a given pace. In theory, since both ventilation and heart rate are tied to the same metabolic process, they should generally move in the same direction (for the same pace) as fitness improves or degrades.
For example, if through training you are able to improve your mitochondrial efficiency, this should, all other things being equal, lower both required oxygen (which is correlated to heart rate) and CO2 production (which is correlated to ventilation) to power the same pace. This means that if heart rate elevates at a faster rate compared to ventilation at the same pace, it could be a signal that an increase in core temperature is pulling up heart rate and decoupling it from ventilation, which stays truer to metabolic demand.
The following table shows the Fatigue Score after each interval for both of my workouts on 9/2 and 9/9:
| Interval | Sept 2 · Hot gym | Sept 9 · Cool gym |
|---|---|---|
| 1 | 98.6 (VE 148.93/HR 151.06) | 101.6 (VE 147.18/HR 144.87) |
| 2 | 98.7 (VE 155.19/HR 157.22) | 103.3 (VE 158.51/HR 153.52) |
| 3 | 99.7 (VE 159.95/HR 160.42) | 102.3 (VE 158.80/HR 155.22) |
| 4 | 102.4 (VE 165.54/HR 161.70) | 100.8 (VE 159.58/HR 158.33) |
| 5 | 97.5 (VE 159.53/HR 163.56) | 100.7 (VE 160.81/HR 159.71) |
Note a couple of things: (1) the Fatigue Scores on 9/2 (hot commercial gym) were lower across the board compared to the Fatigue Scores on 9/9 (cool apartment gym) other than the 4th interval on 9/2 where I had stomach issues; and (2) the general trend on both days was that the Fatigue Score decreased in later intervals, indicative of core temperature causing HR to rise disproportionately to VE.
This downward trend was even more exaggerated between the Fatigue Scores for my 9/9 warmup and cooldown. The Fatigue Score for the warmup was 90.6, in range with my baseline for this pace of 88.5. However, the Fatigue Score for the cooldown was 63.7, which was more than one standard deviation lower than my baseline for the pace of 73.5.
| Sept 9 | Pace | Avg HR bpm | Avg VE L/min | 6m VE L/min · actual / baseline | Fatigue actual / baseline |
|---|---|---|---|---|---|
| Warmup | 8:20/mi | 129 | 117.3 | 118.7 / 122.0 | 90.6 / 88.5 |
| Cooldown | 9:50/mi | 131 | 81.9 | 81.7 / 88.0 | 63.7 / 73.5 |
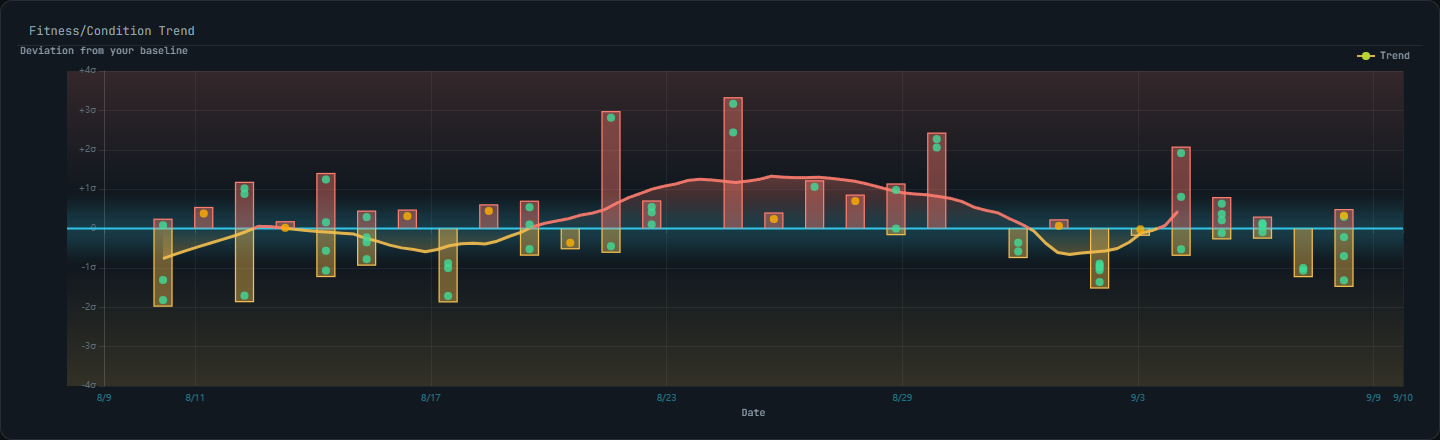
This pattern of the Fatigue Score dropping relative to baseline as sessions progress has, in my experience, been so commonplace that it is the primary reason why a significantly low Fatigue Score is indicated by yellow in VTCheck. For the other 3 baseline metrics (VE, Drift and Recovery), values that deviate from the baseline by more than one standard deviation are colored either green (indicating a positive deviation) or red (indicating a negative deviation), but because a low Fatigue Score appears to primarily result from overheating, we decided to color it yellow as a warning signal.