Efficiency %
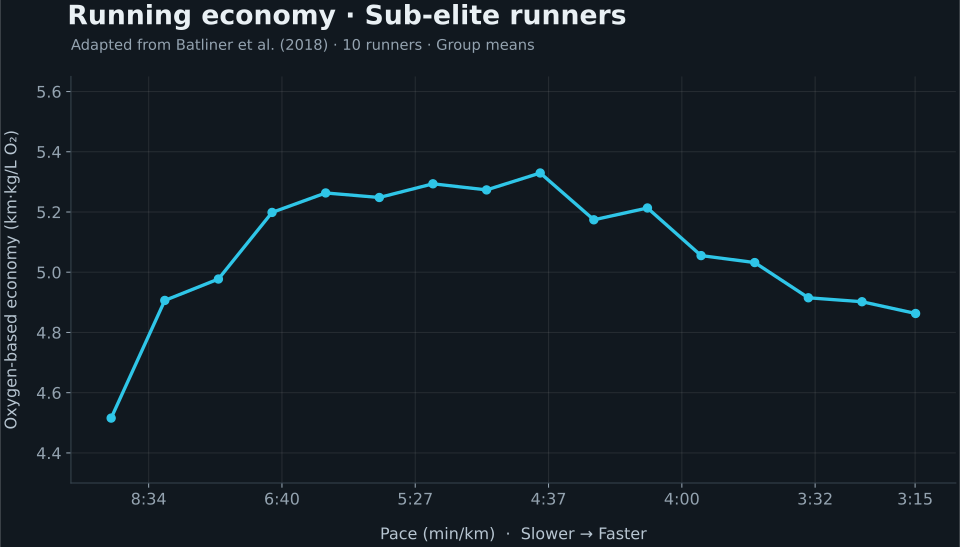
Running Economy has been a trendy topic of discussion in the running world over the past few years as it is one of the fundamental pillars of endurance performance alongside VO2max, fractional utilization and durability. Running economy is commonly defined as the oxygen cost of running at a given speed. The general idea, is that since oxygen is needed to produce energy in the mitochondria, an athlete that requires less oxygen to power a given pace compared to another athlete is more economical or efficient with his energy use. VTCheck provides an analogous metric to running economy called the Efficiency %.
The Efficiency % is simply calculated as an athlete’s speed divided by ventilation, multiplied by 100. Since, as discussed in the Ventilation blog, ventilation is primarily driven by the need to eliminate CO2 (and is therefore highly correlated with CO2 output), and increased energy production not only increases O2 uptake, but CO2 output as well, the Efficiency % can also be used to assess the energy efficiency of a given athlete.
The Efficiency % can be used as a proxy to gauge both an athlete’s fitness and condition. If an athlete’s Efficiency % increases at the same pace and under the same conditions (e.g. running environment, temperature, diet, fatigue etc.) on a consistent basis, it can be an indication of improving fitness and/or running form. In contrast, if an athlete’s Efficiency % decreases at the same pace and under the same conditions, it can be an indication of loss of fitness and/or deterioration of running form.
And if an athlete’s fitness has not materially increased or decreased (e.g. during a short time window) or altered his running form, changes to the athlete’s Efficiency %, all other things being equal, can be indicative of a change to the athlete’s condition potentially due to one or more of the following factors:
Muscle Impairment: When muscles are damaged or otherwise impaired, they may not be able to contract with as much force. So to power the same pace, additional muscle fiber recruitment may be required, which raises both O2 uptake and CO2 output. Additionally, due to the size principle, when more muscle fibers are recruited, particularly at higher intensities, they are more likely to be fast-twitch, which are highly glycolytic and generally produce more CO2 compared to highly-oxidative slow twitch fibers. This is the same reason why running uphill will significantly lower your Efficiency % compared to running on flat ground – greater muscle fiber recruitment.
Muscle Afferents: Even when there is no change to metabolic demand or CO2 accumulation, ventilation can increase through neuromuscular feedback. There are specialized sensors throughout the body that can trigger additional ventilation through the nervous system when muscles and/or the environment surrounding the muscles are in a state of stress, such as due to damage or lowered pH.
Elevated Core Temperature: When core temperature is elevated, sensors located in the neck can trigger elevated ventilation through additional respiratory drive independent of metabolic demand. Additionally, heat can also reduce oxygen flow to the working muscles by diverting blood flow to the skin in order to cool the body off. Although this effect can be mitigated by increasing heart rate and/or redistribution of blood to the muscles from other sources, if these mechanisms are inadequate, the body may shift energy production towards anaerobic glycolysis, which generally results in more CO2 and higher ventilation.
Depleted Glycogen: Although in some circumstances, such as at lower intensities, low muscle glycogen levels may reduce ventilation by shifting energy production towards fat utilization, which generates less CO2, studies have shown that low glycogen levels may at times increase ventilation, particularly at higher intensities. The exact mechanism for why this occurs is not clear, but it may be the result of inhibition of muscle contraction.
We can’t pinpoint exactly which of these underlying factors may be causing higher than normal ventilation during a given workout without additional testing. However, in my experience, higher-than-normal ventilation at the same pace and under the same conditions, without a change in fitness or form, is almost always associated with impaired condition or fatigue. Accordingly, even if an athlete doesn’t know precisely why his ventilation is high, this signal can nevertheless be used to conservatively modulate training. As such, the Efficiency % is presented in the VTCheck ecosystem in a few different ways.
“Live” Efficiency % Readings
For the Garmin VTCheck app, users can select to add a “live” Efficiency % metric as a data field by selecting it in the mobile app and then pushing the settings to your Garmin.
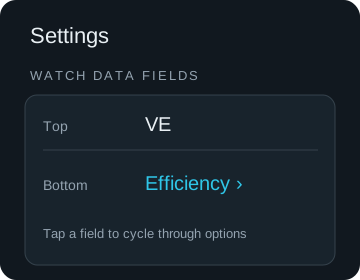
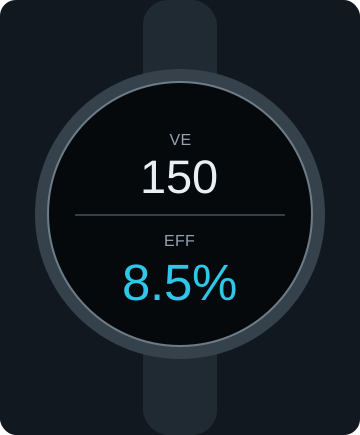
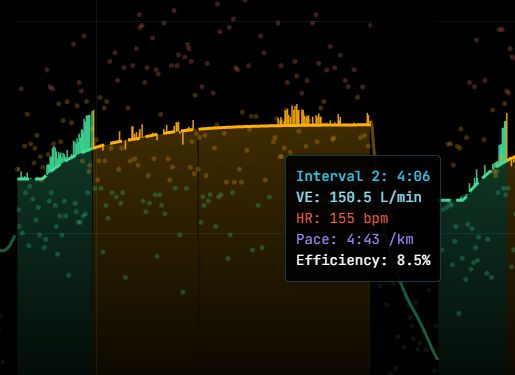
The live Efficiency % is calculated as a moving average based on your recent pace and ventilation levels. As such, this is a lagging indicator and will be most useful for sustained paces (e.g. 3 minutes or longer). The live Efficiency % is not shown on the VTCheck mobile app, as it is a substantively similar metric to ventilation. However, the live Efficiency % can be viewed for individual VE workouts in the webapp, by hovering your mouse over the graph, which exposes “Efficiency” in a tooltip.
Baseline and Target Efficiency %
Similar to 6m VE, Drift, Recovery and Fatigue, the webapp also tracks each workout’s overall Efficiency % for efforts at or near a constant pace at least 6 minutes in duration. For this purpose, the Efficiency % is calculated as the average speed divided by average ventilation starting at the end of the ramp-up period for the effort, multiplied by 100.
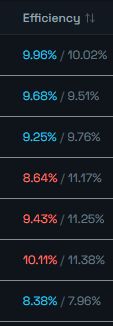
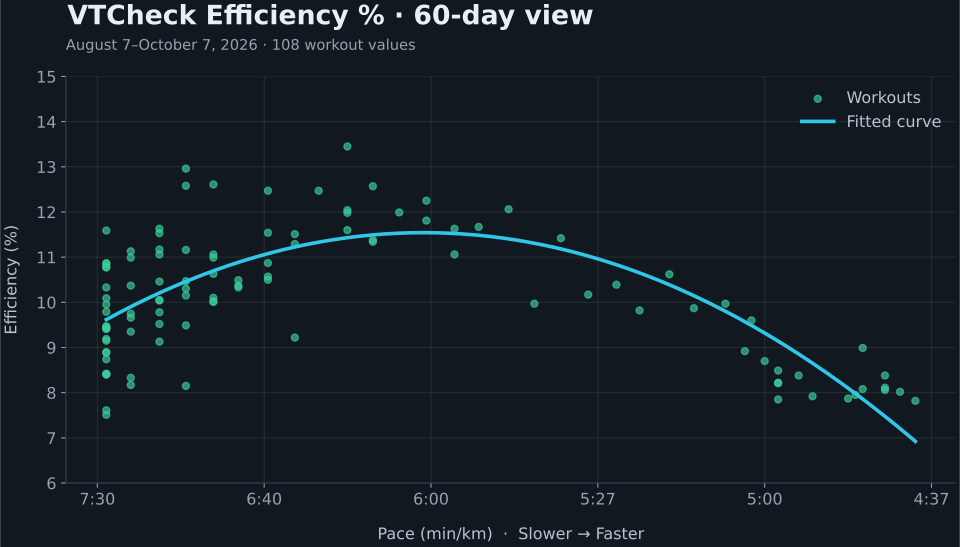
Once you have sufficient qualifying workouts, a regression analysis is applied to the Efficiency % values from your workouts to estimate your “average” Efficiency % at each pace.
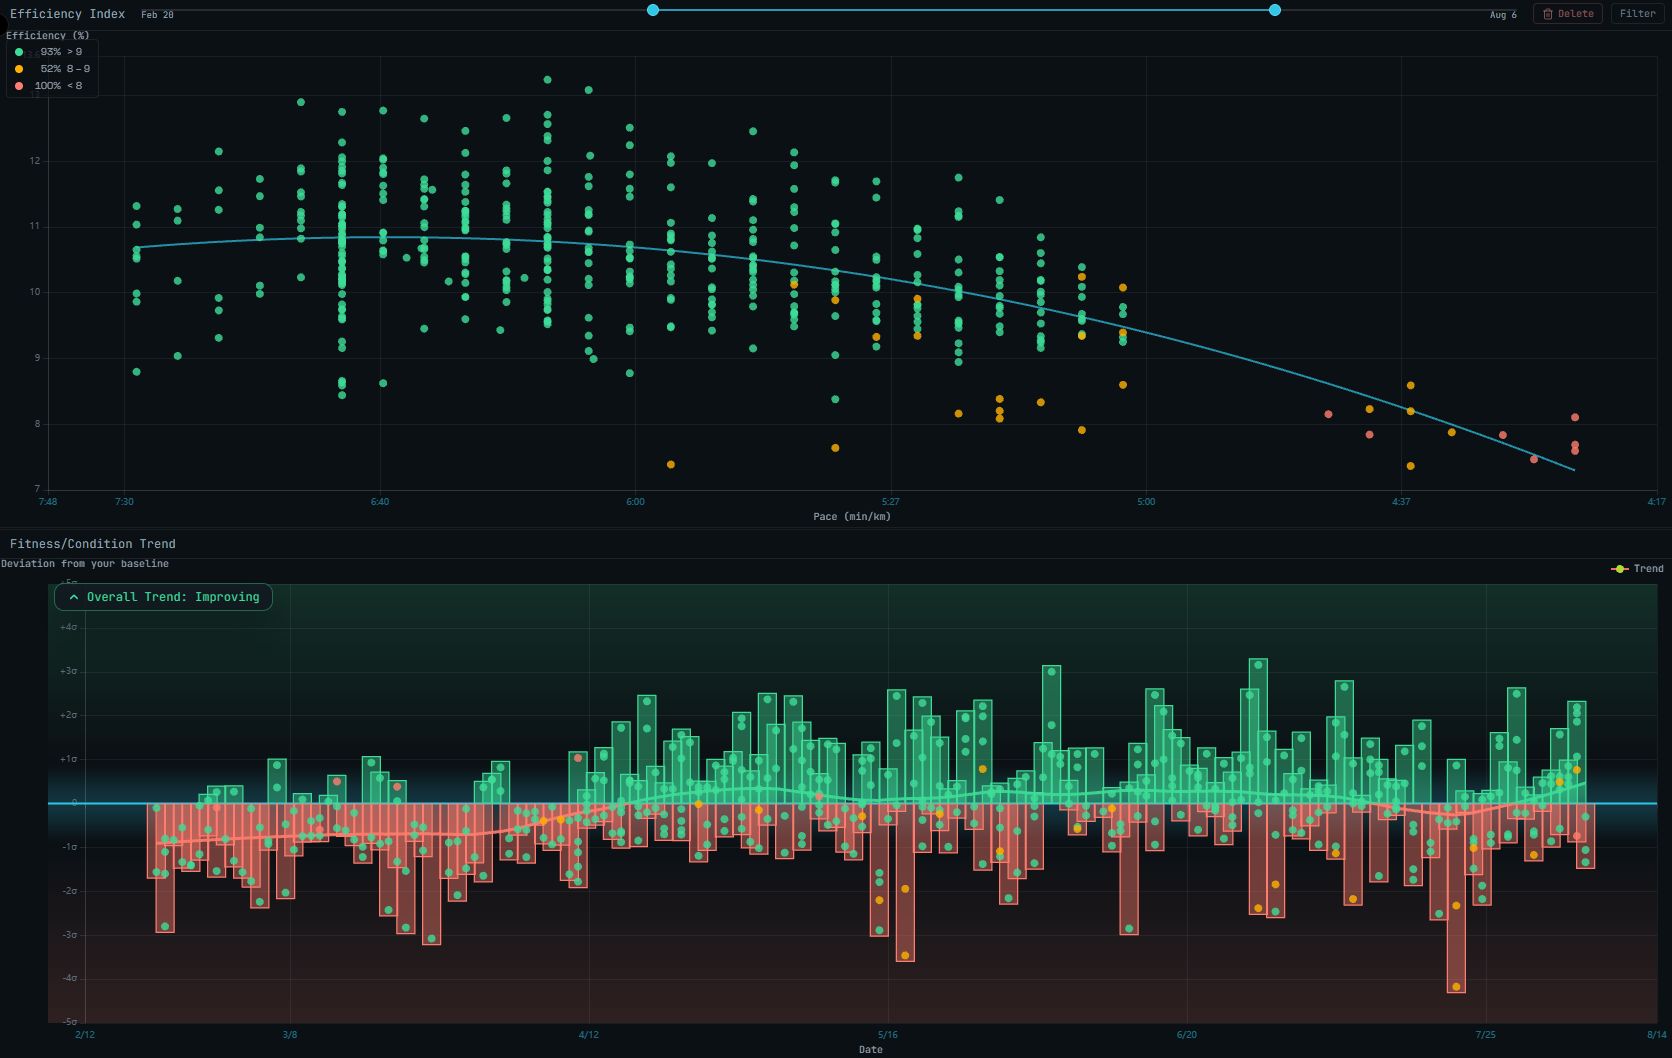
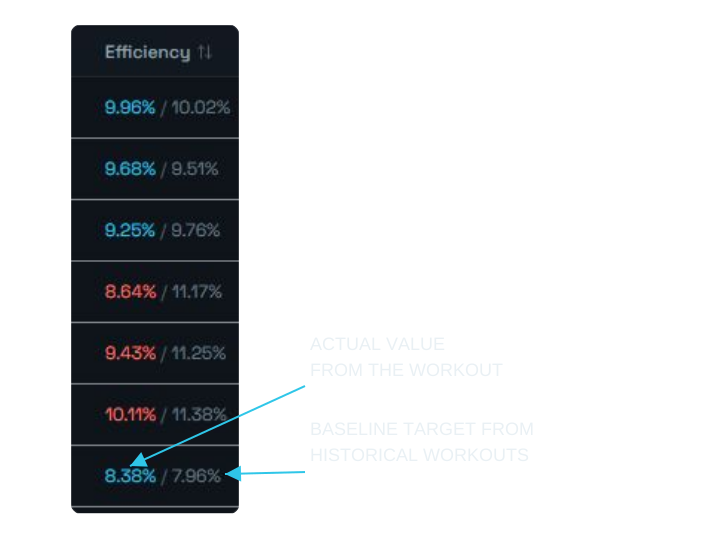
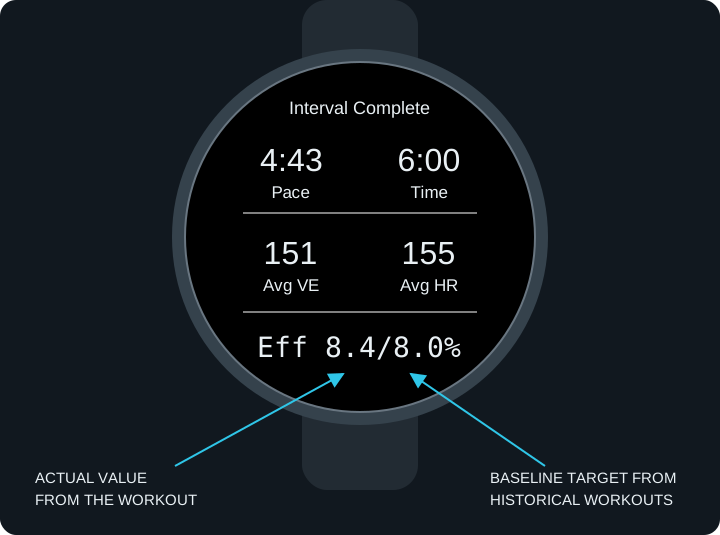
From this regression analysis, the VTCheck webapp creates Target values as a baseline for your future workouts so you can assess how close or far away you are from your baseline during a given workout. These Target values will appear both in your summary of workouts on the webapp, as well as in the summary screen after completing an interval or block on the Garmin app.